
This is a continuation of our series about lessons and successes from the Teacher Preparation Data Project.
The Ed-Fi Teacher Preparation Data Model (TPDM) is a significant step to bring together previously disconnected data into one location for teacher preparation programs and their state and district partners. This takes care of the behind the scenes “plumbing.” But you would not normally expect a dean or site coordinator to create a SQL query on a database to determine how their teacher candidates are doing. So, there was still a need for a method to provide the right data at the right time to stakeholders.
We embarked upon an effort to develop a Teacher Preparation dashboard to use as part of the Ed-Fi TPDM solution. Similar to the TPDM, we gathered input and best practices from the people who do this and need this every day. The goal was to create a dashboard and reporting tool that would answer a majority of the questions a dean, site coordinator, faculty member, etc., needs to know about how their program is preparing teachers. A “collaboratively developed” tool could then be configured to the specific terminology, rubrics, and surveys and program uses and customized for any special use cases.

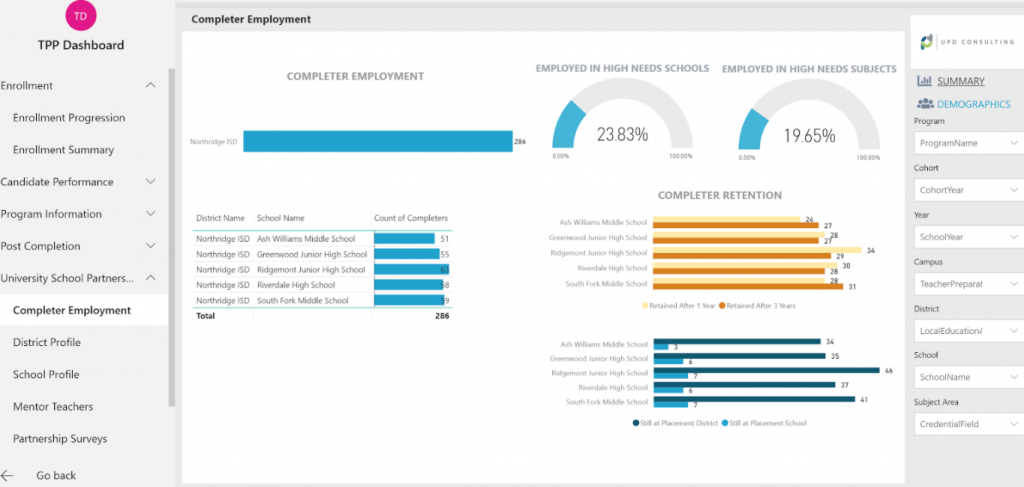
The TPP dashboard answers questions around who TPPs are enrolling in their programs, how well their teacher candidates demonstrate the knowledge and skills needed to be successful teachers, where their teachers are placed and how they perform once there, and what their impact is on K-12 students.
There were plenty of challenges around this development effort including prioritizing the most important visualizations across stakeholders from many different programs with different perspectives, designing visualizations before we had real data, selecting the dashboard platform that would meet most programs needs without being cost prohibitive, and creating sample data that could be used in the demo version. Today though, we are beyond excited and proud to present the first version of the Teacher Preparation dashboards available on the Ed-Fi Exchange that can be used by any institution with the Ed-Fi TPDM.
We would also like to recognize everyone who participated in the dashboard convenings, virtual sessions, and demo presentations. Your expertise, critique and feedback has helped this tool get to where it is today, and will continue to get better as more and more people use it.

Stakeholder group reviewing sample visualizations during convening in Baltimore.

Stakeholders providing feedback to dashboard mockups during convening at UNT Dallas.
The dashboard is developed as a series of modules that can be used to visualize data from Enrollment to Candidate Performance to Post-Completion, based on the type of data that a TPP is able to make available to their stakeholders. This will be the first of many iterations of the dashboard, which will be updated based on feedback from those who review and use the tool in their programs.
Our hope is that the dashboard:
- Sparks conversation between TPPs, districts, and states about how data could be used with better access to this data
- Is used in faculty meetings, data days, and one-on-one meetings so that stakeholders can better understand how their programs are preparing teachers and identify potential improvements
- Generates discussion about which data are REALLY useful and actionable
- Is adapted into uses for states and districts to understand their teacher pipeline and talent management
For now, we encourage you to review this interactive demo version and let us know if you have thoughts, questions, and ideas. Click the link below to access a demo. The form will provide a username and password that has a PowerBI license which will enable you to access the dashboard.
Access a demo of the dashboard here: http://bit.ly/dashboarddemoaccess
See the last post in this series: http://www.updconsulting.com/teacher-prep-data-project-on-the-road/
For more information, contact aquintana@updconsulting.com
Leave a Reply
The comments are closed.